Tu‑154M go‑around: what the Russian manuals require vs. what the MAK reconstruction assumes
1) What the Russian Tu‑154 manuals actually say (practical aerodynamics)
Engine regime strongly affects longitudinal balance. Reducing power increases a nose‑down pitching moment and bends the flight path downward; one must promptly correct with control column and MET (trim) towards nose‑up. At low altitude, avoid reducing RPM more than 3–5 %.
Landing/approach example (Tu‑154B, indicative for Tu‑154M): V≈270 km/h, α≈6°, CY≈1.263, CX≈0.252. If you sharply increase α to ≈11.6°, CY≈1.75 and CX≈0.315; drag rises from ≈12,272 kgf to ≈15,340 kgf.
With gear down, flaps 28°, slats 18.5° and V≈288 km/h, level‑flight drag ≈ 11,400 kgf. With flaps 45° and V≈270 km/h it’s ≈16,000 kgf; i.e. going 28° → 45° needs +≈4,600 kgf extra thrust for the same level condition.
Rule of thumb: for clean wing at 400 km/h the required thrust is only ≈5,300 kgf, but at 270 km/h with full high‑lift the required thrust roughly triples. In IMC/low‑altitude work you must account for this.
What this means: In the landing configuration the Tu‑154’s drag climbs steeply with any extra lift demand (CD≈CD0+k·CL²). If thrust is low, you also start with a nose‑down bias to overcome. A go‑around from near‑idle therefore needs thrust first, then pitch—exactly what the manuals teach.
2) The MAK initial conditions at Smolensk (as reconstructed)
Thrust: engines near idle at go‑around initiation („малый газ”).
Speed: ≈76 m/s (≈274 km/h IAS).
Vertical speed: ≈−7 m/s (descent).
Configuration: landing—slats extended, flaps ~36°, gear down.
Those are precisely the conditions where the manual cautions are most binding: low thrust + high drag + full mechanisation + manual control under stress.
3) A quick physics check (2‑second window)
Even if the pilot commands a prompt normal‑load increase to Ny≈1.3–1.35 g, the vertical acceleration is only (Ny−1)g ≈ +3.2…3.4 m/s². From −7 m/s you therefore need about 2 s just to stop descending—and that assumes instantaneous response and no extra drag. In reality:
raising α to generate lift immediately raises CD (induced and profile), so V decays;
thrust–pitch coupling at low power adds a nose‑down bias you must cancel with more α (even more drag)
engines from near‑idle spool slowly; the first ~2 s bring minimal thrust.
4) Human factors and realistic variability
A simulator series (“English case” style) with manual control, idle→go‑around thrust, and crew stress vs training shows:
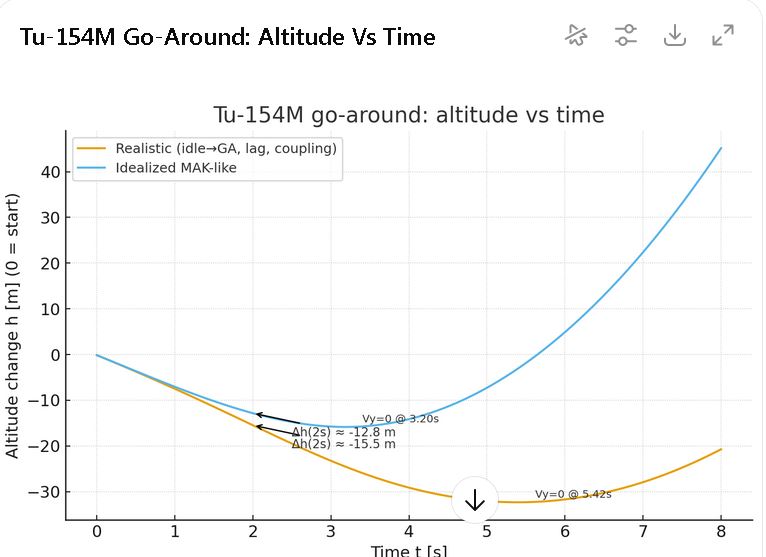
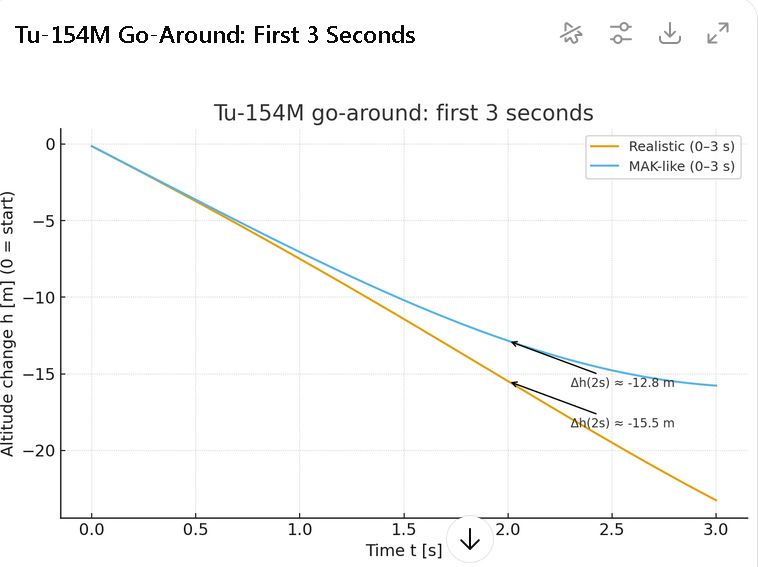
Δh after 2 s: typically −15.5 m (stressed/untrained) vs −14.8 m (trained), when thrust–pitch coupling is modelled.
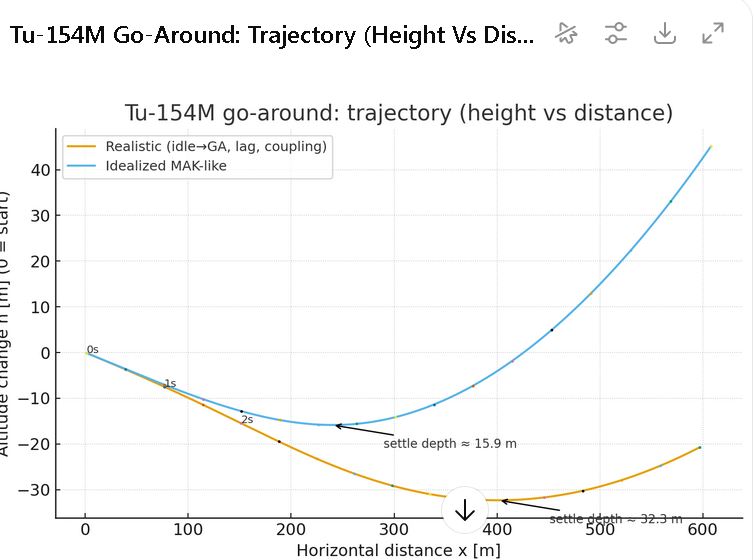
Depth to arrest descent (Δh to Vy=0): around −45…−50 m (stressed/untrained) and ≈−30 m (trained).
Speed loss to Vy=0: about −5…−7 m/s.
These ranges match the manuals’ qualitative warnings: from near‑idle, a Tu‑154M will sink first before climbing, and poor timing/overshoot can make the sink notably deeper.
Contrast with an “idealised” trace: If you assume very fast Ny response, immediate thrust command and no coupling, you can obtain a shallow Δh to Vy=0 ≈ −16 m and ΔV ≈ −2.7 m/s. That picture, however, omits the Tu‑154’s known characteristics and crew delays—it is not a faithful reconstruction of a real‑world go‑around from near‑idle.
5) Why this matters for the 2010 Moscow simulator run
A faithful reconstruction of the Smolensk go‑around must include, at minimum:
1.Engine model: idle at initiation; realistic spool‑up to GA (several seconds); thrust–pitch coupling (nose‑down bias at low TTT).
2.Aerodynamics: landing‑config drag law calibrated to Tu‑154 data (e.g., near 270 km/h, α: 6° → 11.6° raises drag from ≈12.3 t to ≈15.3 t); correct S, ρ, mass.
3.Ny envelope: ≤~1.35 g as an operational cap for approach/landing; no forced, sustained overshoots.
4.Dynamics & delays: in‑axis lag (I‑order + pure delay) for Ny response; manual control profiles (recognition time, throttle‑push delay, overshoot/jitter under stress).
5.Outputs to disclose: time‑aligned traces of column/elevator, Ny, α, thrust, V/Vy, plus exact aero database used (CD0, k, configuration scalars).
Without these, a simulator “result” risks being an idealised training picture, not a physics‑consistent reconstruction of the MAK scenario.
6)Numbers and assumptions used here (for transparency)
Initial state: m≈76 t; V≈76 m/s (≈274 km/h); Vy≈−7 m/s; landing configuration (slats extended, flaps ~36°, gear down); ρ≈1.2 kg/m³; S≈201 m².
Drag model: CD=CD0+kCL2C_D=C_{D0}+kC_L^2CD=CD0+kCL2 calibrated at 270 km/h using Tu‑154 book points: CD0≈0.129C_{D0}≈0.129CD0≈0.129, k≈0.030k≈0.030k≈0.030 (yields ≈12.3 t → ≈15.3 t drag when α jumps 6°→11.6°).
Thrust: total GA thrust scaled to order‑of‑magnitude values; idle for ~2 s; linear spool‑up over ≈4 s; thrust–pitch coupling modelled as a nose‑down bias at low TTT.
Human factors: Monte‑Carlo over recognition delay, throttle‑push delay, Ny ramp slope, overshoot/jitter, and Ny dynamics (τ, Td), with “untrained/stressed” vs “trained” parameter bands.
Caveat: The figures above are illustrative (engineering‑level consistency check), not a claim to replace FDR‑grade reconstruction. They are, however, anchored to Tu‑154 practical‑aerodynamics data and reproduce the qualitative behaviours that the manuals emphasise.
7) Takeaways (for investigators and readers)
A Tu‑154M go‑around from near‑idle in full landing configuration will first lose height—order 12–16 m in ~2 s, then tens of metres more before Vy reaches zero—unless thrust arrives first and control is precise.
Any simulator trace that shows a shallow sink (≈15–20 m to Vy=0) with minimal speed loss from near‑idle is incompatible with the Tu‑154’s documented behaviour and with manual, stressed crew response.
To be credible, a reconstruction must publish the inputs and aero model, not just the plotted results.

Dodaj komentarz